#Report an interval, and use the right one
Attack success rate (ASR) is a binomial proportion: successes in attempts. The textbook (Wald) 95% interval is . At the success rates that matter for guardrails — a few percent — it is badly wrong. We simulated 200,000 red-team runs per cell and measured how often each nominal 95% interval actually contained the true rate:
| Attempts n | True ASR | Wald coverage | Wilson coverage |
|---|---|---|---|
| 20 | 1% | 18.2% | 98.3% |
| 50 | 1% | 39.5% | 91.0% |
| 100 | 1% | 63.3% | 92.1% |
| 50 | 3% | 78.1% | 93.8% |
| 200 | 3% | 93.2% | 94.4% |
| 100 | 10% | 93.2% | 93.6% |
The Wald interval's coverage at , is 18%: it is a 95% interval in name only, because with zero observed successes it collapses to . Use the Wilson score interval [1]:
def wilson(k, n, z=1.96):
    p = k / n
    den = 1 + z*z/n
    c = (p + z*z/(2*n)) / den
    h = z * sqrt(p*(1-p)/n + z*z/(4*n*n)) / den
return max(0, c - h), min(1, c + h)#Zero successes is a number, not a pass
When nothing works, the exact one-sided 95% upper bound on the true rate solves , i.e. . Since , this is approximately — the "rule of three" familiar from clinical trials [2]. Turned around, it tells you how many clean attempts you need before you can claim a bound:
| Claim: true ASR below | Attempts needed (exact) | Rule of three |
|---|---|---|
| 10% | 29 | 30 |
| 5% | 59 | 60 |
| 1% | 299 | 300 |
| 0.5% | 598 | 600 |
| 0.1% | 2,995 | 3,000 |
So "0 of 50" supports only "the true rate is below about 6%". If your agent handles a million conversations a month, a 6% ceiling is not reassuring. To claim below 0.1% you need roughly 3,000 clean, independent attempts — and independence is the hard part, which brings us to attackers who don't give up.
#Attackers sample, so ASR is a curve, not a number
A single attempt's success probability is the wrong unit for an adaptive attacker. Hughes et al. showed that simply resampling augmented prompts — random capitalization, character noise — reaches high ASR on frontier models given enough attempts, and that ASR as a function of attempts follows power-law-like behaviour [3]. A simple model explains why.
Suppose each attempt's success probability varies (some augmentations land, most don't), with . Then
and for large , using ,
The probability that the attacker still hasn't succeeded decays as a power law in , with exponent equal to the Beta shape . A homogeneous instead gives exponential decay . We checked the closed form against Monte Carlo for (mean per-attempt success 1%):
| Attempts N | Closed form ASR | Monte Carlo ASR |
|---|---|---|
| 1 | 1.0% | 1.0% |
| 10 | 8.3% | 8.4% |
| 100 | 35.8% | 35.8% |
| 1,000 | 65.5% | 65.6% |
| 10,000 | 82.6% | 82.6% |
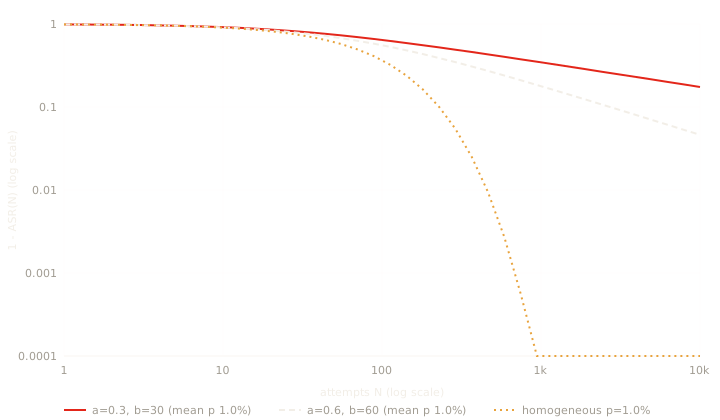
Two consequences matter for defenders. First, a per-attempt ASR is meaningless without : the same system is "1% vulnerable" at and "83% vulnerable" at . Report for the a realistic attacker can afford. Second, the power law means there is no plateau to wait for: doubling the attacker's budget multiplies remaining failure probability by , forever. Rate limiting and anomaly detection on repeated near-identical requests are therefore genuine controls, not hygiene.
#Pooled ASR hides the goals that matter
Red-team suites test many objectives (exfiltrate the system prompt, call the refund tool, leak another user's data). Averaging across them produces a reassuring headline. We simulated 50 objectives with heterogeneous difficulty, 40 attempts each:
- Pooled ASR: 9.8%.
- Objectives with at least one success: 30 of 50.
- Worst single objective: 55% of attempts succeeded.
A 10% pooled number is compatible with one objective that fails open half the time. Report per-objective results, and weight objectives by impact, not equally.
#Comparing two guardrails takes more trials than you think
To show a new guardrail reduces ASR from to with a two-sided two-proportion z-test at and 80% power, each arm needs
| Baseline ASR | New ASR | Attempts per arm |
|---|---|---|
| 20% | 10% | 199 |
| 10% | 5% | 435 |
| 5% | 2% | 588 |
| 2% | 1% | 2,319 |
| 1% | 0.5% | 4,673 |
Halving a 1% ASR takes about 4,673 attempts per configuration. That is why automated adversarial generation is not optional: no human team runs 9,000 careful injection attempts per release. It is also why "we tried the new filter on our 30 favorite jailbreaks" is not evidence.
#A reporting standard we hold ourselves to
- Every ASR is reported as with a Wilson 95% interval.
- Every ASR states the attempt budget per objective and whether attempts were adaptive.
- Zero-success results are reported as an upper bound, never as "pass".
- Results are per objective, with the worst objective called out.
- Guardrail comparisons state the sample size and the minimum detectable effect.
#Choosing N: what an attacker can afford
Since ASR is a curve, the defender's job is to decide which point on it matters. The attempt budget follows from access and rate limits. Using the same Beta(0.3, 30) model:
| Attacker budget | Attempts N | Modeled ASR@N |
|---|---|---|
| Manual tester, an afternoon | 100 | 35.8% |
| Scripted, one day at 1 request / 10 s | 8,640 | 81.8% |
| Scripted, one day at 1 request / s | 86,400 | 90.9% |
Two practical conclusions. First, rate limits are a security control with a quantifiable effect: cutting the per-identity budget by 100× moves the modeled ASR from 91% to 64% ( vs ) — useful, not sufficient. Second, the asymptotic formula is accurate only for large : at it predicts 69% failure where the exact value is 64%. Use the exact Beta-function form for budgets in the hundreds.
Estimating a and b from your own red-team data
Fit the Beta parameters by maximum likelihood to per-variant success counts (beta-binomial), or more simply by method of moments from the mean and variance of per-variant success rates. Then report the fitted curve, not a single number, and re-fit after every guardrail change.
#Multi-turn and agentic attacks change the unit
Everything above treats an attempt as one prompt. Against agents, the natural unit is an episode: a conversation or task in which the attacker can observe responses and adapt, and in which injected content may arrive several tool calls deep. Two adjustments keep the statistics honest. Count successes per episode, not per message, so a ten-turn manipulation that succeeds on turn nine is one success out of one episode, not one out of ten. And record the budget in the unit an attacker pays for — episodes per account per day — because that is what rate limits and abuse detection constrain.
A minimal results table for one release then looks like this, with one row per objective:
| Objective | Channel | Episodes | Successes | ASR (Wilson 95%) |
|---|---|---|---|---|
| Leak system prompt | chat | 400 | 3 | 0.75% (0.26%–2.2%) |
| Refund via injected ticket | ticket body | 400 | 0 | 0% (0%–0.95%) |
| Exfiltrate via markdown image | retrieved page | 400 | 11 | 2.75% (1.5%–4.9%) |
(Illustrative layout; the intervals are computed with the Wilson formula above.)
#Limitations
The Beta model is a convenient explanation of power-law-like scaling, not a claim that real attacks are Beta-distributed; Hughes et al. fit a different functional form directly to data [3]. Binomial intervals assume independent attempts, which adaptive attacks violate by design — treat intervals from adaptive campaigns as descriptive. Coverage numbers come from simulation at the stated parameters.
#Frequently asked questions
What is attack success rate (ASR) in AI red teaming?
Attack success rate is the fraction of attack attempts against an AI system that achieve the attacker's objective, such as extracting a system prompt or triggering an unauthorized tool call. It should always be reported with the number of attempts and a confidence interval.
How many prompt injection attempts do I need to test?
To claim the true success rate is below 1% with 95% confidence after observing zero successes, you need about 300 independent attempts; below 0.1% needs about 3,000. Comparing two guardrails at low success rates typically needs thousands of attempts per configuration.
#Sources
- [1] E. B. Wilson, “Probable Inference, the Law of Succession, and Statistical Inference,” Journal of the American Statistical Association 22(158):209–212, 1927 (overview of the Wilson score interval)
- [2] J. A. Hanley, A. Lippman-Hand, “If nothing goes wrong, is everything all right? Interpreting zero numerators,” JAMA 249(13):1743–1745, 1983
- [3] J. Hughes et al., “Best-of-N Jailbreaking,” arXiv:2412.03556, 2024
Get statistically honest AI red teaming.
Rogue/AI runs thousands of adaptive attempts per objective every release and reports ASR@N with intervals, per objective.
Book a briefing