#Setup: percolation on an attack graph
Attack graphs have been a research staple since Sheyner et al. generated them automatically with model checking in 2002 [1]. The idea is simple: nodes are attacker states (a foothold on a host, a credential, a role), edges are exploitable steps between them. A breach is a path from the internet to something you care about.
We add probabilities. Each edge works independently with probability — the chance that, in practice, the step succeeds (the service is reachable, the exploit is reliable, the credential is still valid). The probability that the crown jewel is reachable is then a bond-percolation problem:
There is no closed form for general graphs (computing it exactly is #P-hard), so we estimate it by Monte Carlo: sample every edge's state, run reachability, repeat. A fix sets .
Graphs
Each synthetic graph has five layers: the internet, 24 external assets, 48 internal hosts, 12 privileged identities or systems, and one crown jewel. Nodes in each layer receive two to four inbound edges from the layer before (the perimeter is thinned to 60%). Edge probabilities are drawn from , mean 0.4. We ran two topologies, 20 graphs each:
- Chokepoint: the crown jewel is reachable from exactly 4 privileged nodes.
- Diffuse: the crown jewel is reachable from all 12 privileged nodes plus 6 "misconfiguration shortcut" edges straight from internal hosts.
Severity scores
Each edge also gets a severity score in , generated through a Gaussian copula with correlation to the edge's true probability. Severity is therefore informative but weak, and it knows nothing about topology. That is a deliberate caricature of base-score severity, which describes a vulnerability's characteristics rather than its likelihood of use in a given environment.
#Four ways to spend a budget of k fixes
- Severity-first: fix the highest-severity edges.
- Likelihood-first: fix the edges with the highest . This is the policy an ideal exploit-likelihood score (in the spirit of EPSS [2]) would give you if it were perfectly accurate.
- Path-aware (greedy): repeatedly fix the edge whose removal most reduces estimated , re-estimating after each fix. This is what proving attack paths end to end gives you.
- Random: the baseline.
Greedy chooses fixes on one set of 1,200 Monte Carlo samples; every strategy is then scored on an independent set of 1,200 samples, so the path-aware policy gets no credit for overfitting to its own noise.
for step in range(k):
    reached = reachable(target, states_without(fixed))
    # only edges that are 'on' in at least one successful sample can matter
    candidates = edges_used_in(reached)
    best = argmin(e -> P_breach(fixed + {e}), candidates)
fixed.add(best)#Results
P(breach) 83.5%
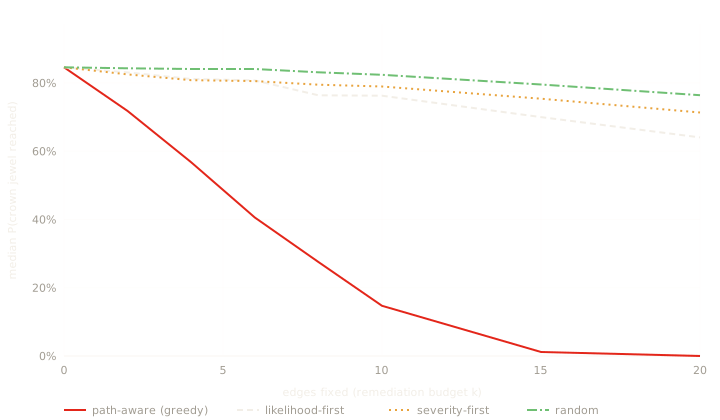
| Fixes (k) | Path-aware | Likelihood-first | Severity-first | Random |
|---|---|---|---|---|
| 0 | 84.6% | 84.6% | 84.6% | 84.6% |
| 4 | 56.8% | 81.2% | 80.8% | 84.1% |
| 10 | 14.7% | 76.3% | 79.0% | 82.4% |
| 20 | 0.0% | 64.0% | 71.3% | 76.4% |
In the diffuse topology the median graph starts at 84.6% breach probability. After 10 fixes, path-aware remediation is down to 14.7%; likelihood-first is at 76.3% and severity-first at 79.0%. Twenty likelihood-first fixes (64.0%) are still worse than six path-aware ones (40.6%).
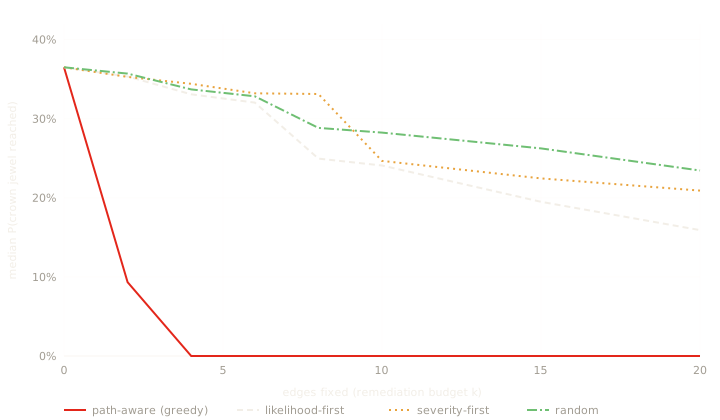
The chokepoint topology is the easy case for a path-aware defender and the instructive case for everyone else. Path-aware remediation finds the 4-edge cut and drives risk to zero by . Likelihood-first spends its budget on the most reliable individual steps — which are scattered all over the graph — and is still at 24.1% after 10 fixes.
#Why likelihood-first loses even with perfect information
It's tempting to read this as "severity scores are bad, use exploit likelihood". The likelihood-first policy here has perfect knowledge of every and still loses badly. The reason is redundancy. The marginal value of fixing edge is
The first factor is what likelihood scores estimate. The second is a property of the graph: if three other working paths bypass , fixing it buys nothing, however likely it is to be exploited. Only something that sees paths — an attack-graph model or an attacker actually chaining steps — can estimate the second factor.
The flip side is also true: a low- edge on every path is worth more than a high- edge on none. In our graphs, the chosen path-aware fixes concentrated in the last two layers (privileged access and the crown-jewel boundary), which is consistent with how experienced red teams describe "fix the identity tier first".
#What to do with this
- Ask "which paths does this fix break?" before "how severe is this?" A remediation queue sorted by severity is optimizing the wrong objective.
- Find your chokepoints. Privileged identity systems, the few hosts that can reach production data, CI runners with deployment credentials. If your environment has them, fixing them is extraordinarily efficient.
- If you don't have chokepoints, build them. The diffuse topology is what you get with flat networks and shortcut access. Segmentation is the act of converting a diffuse graph into a chokepoint graph.
- Use likelihood scores to triage, not to finish. EPSS-style probabilities are a good input for . They are not a substitute for knowing the paths.
#How precise are these estimates?
Each strategy's breach probability on a graph is a Monte Carlo average over held-out samples, so its standard error is
about 1.3 percentage points at and 1.0 point at . The gaps we report between strategies — 60 points in the diffuse topology at — are roughly fifty standard errors wide. The medians across 20 graphs add graph-to-graph variation on top; the qualitative ordering held on every single graph we generated, which we checked in the per-graph log the script prints.
What an attack-path finding should contain
If path-aware prioritization is the goal, findings need to carry path information, not just a severity:
- The full chain, step by step, with the evidence for each step.
- The asset reached and why it matters (the crown jewel, not the first host).
- Which other proven paths share each step — the fix that breaks the most paths first.
- A replay script, so the fix can be verified by re-running the chain rather than re-scanning the host.
A remediation queue built from those fields can be sorted by "paths broken per fix", which is the quantity above estimated from real attacks instead of a model.
#Limitations
The graphs are synthetic and layered; real environments have cycles, credential reuse that creates long-range edges, and correlated edge states (a single compromised credential can activate many edges at once, which percolation with independent edges does not capture). The greedy policy assumes you can estimate well enough to rank fixes — in practice that estimate comes from attack-path discovery and is noisy. Greedy is also not optimal; it is a strong, cheap heuristic. Finally, we hold the cost of every fix equal, which real remediation is not. A cost-weighted version would choose differently but would not rescue severity-first ordering.
#Frequently asked questions
What is attack path analysis?
Attack path analysis models how an attacker could chain individual weaknesses into a route from an entry point to a critical asset, and evaluates which fixes break the most routes. It differs from vulnerability scoring, which rates each weakness on its own.
Is CVSS a good way to prioritize remediation?
CVSS base scores describe a vulnerability's characteristics, not its role in your environment. In our simulation, fixing by severity reduced breach probability barely faster than fixing at random, while path-aware fixing removed most of the risk with the same budget.
#Sources
- [1] O. Sheyner, J. Haines, S. Jha, R. Lippmann, J. M. Wing, “Automated Generation and Analysis of Attack Graphs,” IEEE Symposium on Security and Privacy, 2002
- [2] J. Jacobs, S. Romanosky, B. Edwards, M. Roytman, I. Adjerid, “Exploit Prediction Scoring System (EPSS),” arXiv:1908.04856
See your real attack paths.
Rogue proves attack chains end to end, so every finding comes with the paths it breaks. Remediation queues sort themselves.
Book a briefing